Eniscope Analytics is a web-based, energy diagnostics tool that gives you rich insights into your ‘historical’ energy consumption and the health of your power supply. This can be compared over days, weeks, months or even several years.
Intelligent, flexible & easy to use… Making energy information easy to access and simple to understand. Using your favourite web browser you can do a detailed energy analysis on any equipment, in any building, in any country, at any time… and all from the comfort of your personal computer or mobile device.
The Analytics home screen greets you with a dashboard displaying at a glance how much energy you have used, what it has cost you and what it has cost the environment in carbon emissions – for any selected period.
You are also alerted to your current performance and hourly consumption rate in comparison to a similar period in the recent past.
Any information displayed in Analytics can be instantly printed off to create a report or downloaded to a spreadsheet for further analysis.
Click on the Power tab and you begin to understand the strength and flexibility of Eniscope Analytics. The system will automatically aggregate your data together but at the click of a button you can isolate or compare individual meters. This makes Analytics the ideal tool for understanding and comparing the consumption of different buildings, departments, floors and zones… You can even keep tabs on individual pieces of equipment. Visualizing your energy in this way allows you to see exactly where it’s going and highlights the biggest opportunities for savings.
The ability to compare multiple meters is showcased by the Pie Chart tab… Now you don’t have to settle for the vague ‘one lump sum’ information offered by your utility company. Eniscope Analytics enables you to see and understand the make-up of your energy consumption so you know exactly what you are spending your money on and why.
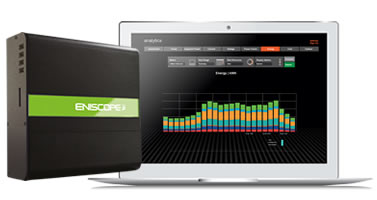
The Energy tab is where you get a more traditional view of your energy consumption… If you are measuring by building or department you can use this data to apportion costs, which helps occupants to become more responsible for the energy they use. It also means you can target reductions and monitor progress for specific areas of your organization.
You can also use this area to pick up on trends and anomalies such as power surges that can lead to peak demand penalties.
The Costs tab converts your energy data into a language that everybody understands – money! It even provides a forecast of what you are likely to spend over the coming week and month so you can budget accordingly or take steps to reduce your consumption. All of the information is displayed in the currency of your choice and you can select a limitless number of tariff options to ensure that your data is highly accurate and matches what you are likely to see on your utility bill.
The Amps, Voltage & Power Factor tabs will take your understanding of your energy consumption to a whole new level. Are unbalanced phases about to expose you to massive equipment failure? Is voltage outside of an acceptable tolerance adding 10% to your utility bill? Is poor power factor shrinking your energy capacity and triggering unnecessary fines from the utility company?
Essentially… Eniscope provides an indication of the ‘health’ of your energy supply. An ‘unhealthy’ supply not only creates the potential for an increase in energy costs but it can often be the cause of equipment failure, electrical hazards and even fires. Eniscope gives you the information you need to eliminate these problems before they strike.
It is becoming increasingly important for organizations to monitor their carbon output… Whether you need it for internal targets, to satisfy new carbon legislation or access carbon funding you can be sure that Eniscope Analytics will keep an accurate track of this valuable data for you.
Eniscope Analytics is your virtual Energy Manager twenty-four hours each day… it can automatically send you a report detailing your energy performance – highlighting your improvements and savings as well as any weaknesses or problems that may need to be investigated.
Eniscope Analytics… an indispensable energy management tool…. delivering all the information you need in an engaging and easy to understand format. Keeping YOU in control of your energy consumption.